Texture
measurement is done in most cases by measuring pole figures. A pole
figure Phkl describes the volume fraction dV/V of the crystallites
whose crystallographic directions <hkl> have a certain
orientation in space:
dV/V = Phkl(α, β)·sin α dα dβ
A pole figure is given graphically as a frequency distribution if crystal
orientations on the reference sphere that is stereographically
projected into the "equator" plane in sample space.
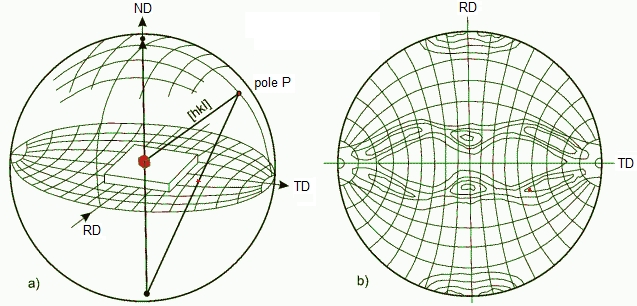
Schematics of a pole figure and its stereographic projection
1. The TEM as an automated texture goniometer
|
1983
|
Acquisition of pole figures by post-specimen beam deflection, but manual correction for the ellipticity of diffraction rings.
F.J. Humphreys: Textures and Microstructures 6 (1983) 45-62
|
|
1983
|
Analytical and experimental on-line intensity correction for SAD pole figures in pre- and post-specimen beam deflection mode.
R. Schwarzer: Beitr. Elektronenmikr. Direktabb. Oberfl. (BEDO) 16 (1983) 131-134
|
|
1984
|
Automated
SAD pole-figure measurement with pre- and post-specimen beam
deflection. On-line correction for background, absorption, diffracting
volume and ring ellipticity by the software.
H. Weiland and R. Schwarzer: Proc. ICOTOM 7 (1984) 857-862
R. Schwarzer: BEDO 18 (1985) 61-68
R.A. Schwarzer and H. Weiland: in H.J. Bunge (ed.): Experimental
techniques of texture analysis. DGM Informations-Ges. Oberursel, 1986,
287-300
|
|
1998
|
RHEED pole-figure measurement on bulk surfaces in the TEM. A digital CCD camera is used as an area detector.
B. Schäfer and R.A. Schwarzer: Materials Science Forum 273-275 (1998) 223-228
|
|
|
Features:
+
Measured area: SAD
1 μm ....
500 μm
RHEED
~ 0.1 - 2 mm
+
High speed: ~ 5 min for the acquisition of several pole figures
+ Extremely high sensitivity.
|
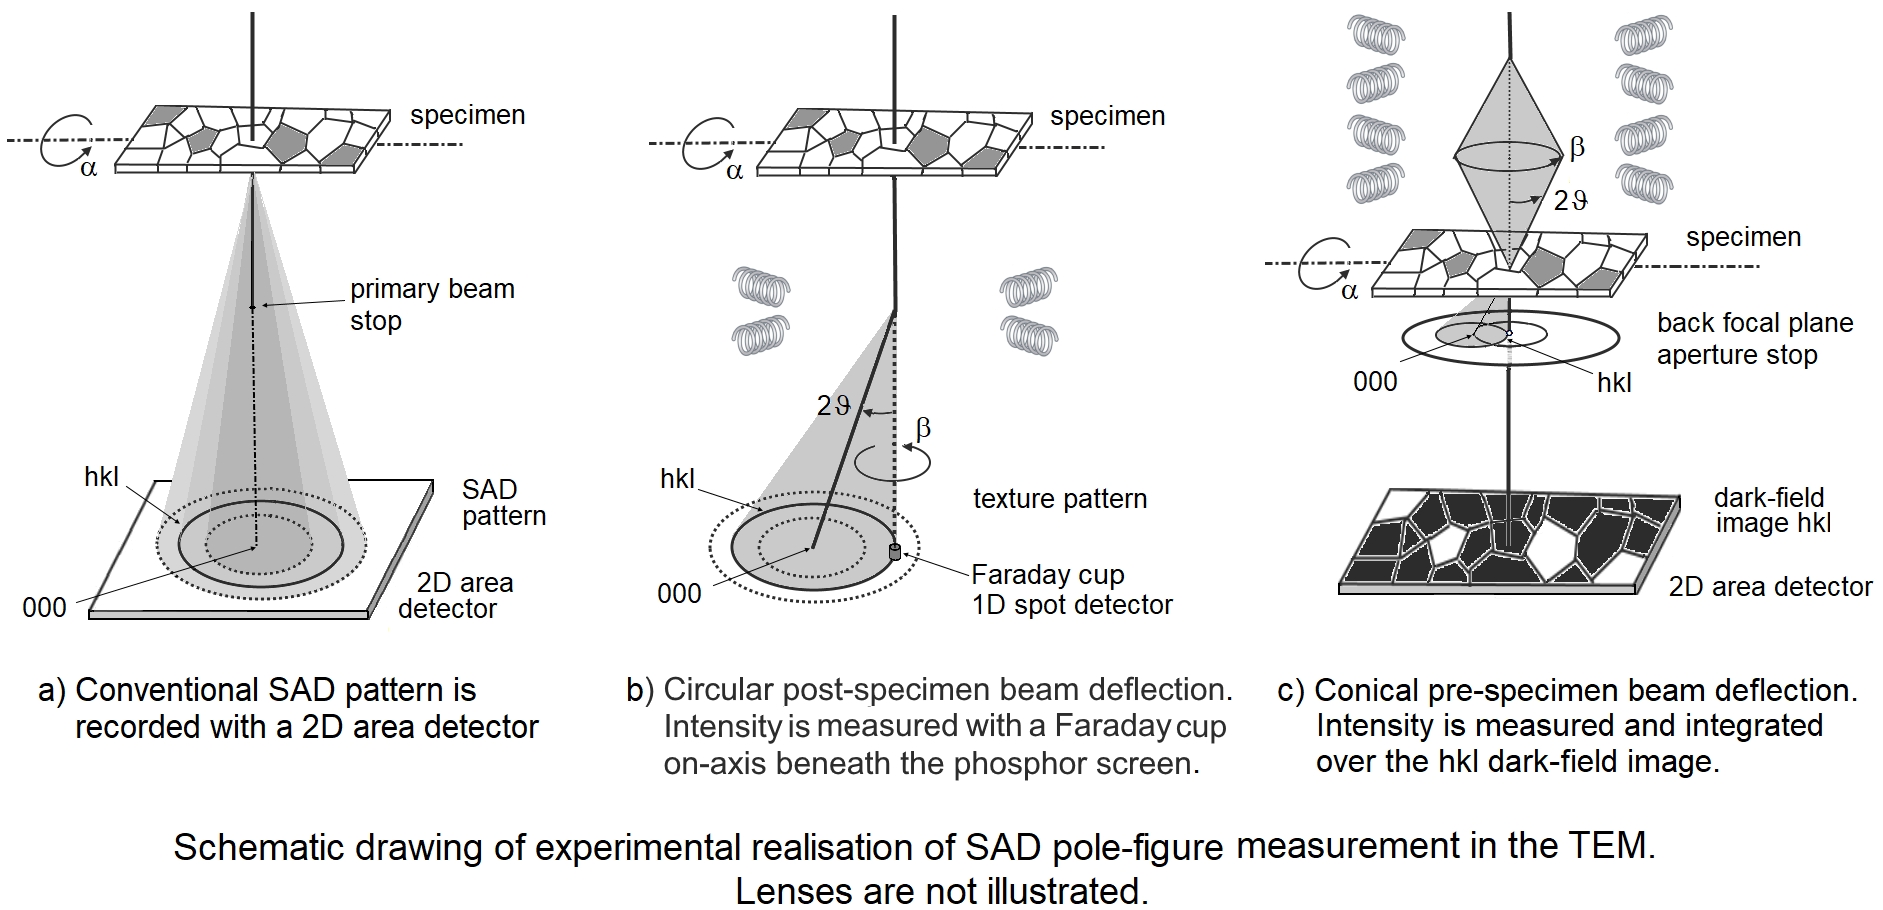
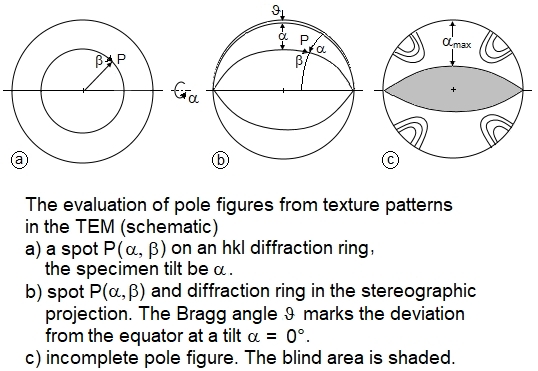
2. The principles of SAD pole-figure measurement
3. The Orientation Density Function ODF
The
Orientation Density Function (ODF) and pole figures can be constructed
either directly from a data set of individual grain orientations by associating
the orientations or the volume fractions of grains having these
orientations with points or discrete cells of finite size in the Euler
orientation space, on pole figures (stereographic projection) or on
inverse pole figures (standard triangle of the crystal symmetry group). Historically, the ODF is calculated by the inversion of pole-figure data from (integral) X-ray diffraction. Various inversion methods have been developed. An elegant
approach to smooth and to condense the data set into a continuous
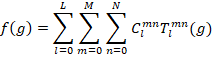
representation is the calculation of the ODF, f(g), by series expansion
into generalized spherical harmonics (T functions) after Bunge [1]:
The expansion coefficients (termed "C coefficients") are then expressed by
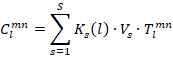
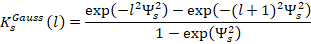
Vs stands for the volume fraction of grain s, and Ks(l) for the convolution kernel of the expansion. Common convolution kernels are a Dirac δ function in case of a large number S of orientations, or Gauss type distributions in Euler space with a half width Ψ0s at 1/e maximum of the Gauss peak at the orientation
point gs [2, 3]
The C
coefficients are a highly concise and convenient description of crystal
texture. They enable the calculation of normal and inverse pole figures,
important elastic and plastic materials properties, and tensorial
properties in general [1]. ODFs calculated from EBSD and from X-ray pole
figure measurements usually agree very well if the data have been
acquired on the same specimen area.
N.B.: In X-ray
diffraction, the reflections and hence pole figures are indexed
according to their diffracting lattice planes {hkl}. By tradition,
inverse pole figures referred to the specimen surface are also indexed
according to the in-surface lattice planes rather than to the
crystallographic directions perpendicular to the specimen surface. This
inconsequent definition is of no relevance in case of cubic crystal
symmetry, but has to be kept in mind
when studying
materials of lower symmetry.
You should keep in mind:
- The ODF is only partially suitable for predicting the properties of
engineering materials. The ODF is an idealizing model of the
polycrystalline solid that reflects only the volume fraction statistics
respectively the numbers of crystal orientations in the measured sample.
It completely ignores the stereology of the microstructure, i.e. in
particular the location of crystallites, the size of individual grains,
their size distribution in the microstructure, their relationship and
interaction with their neighborhood, grain boundaries and phase joints,
joint properties, and the sub-microstructure (e.g. dislocations,
stacking faults and inclusions). The ODF, calculated from the pole
figure inversion, is not unique, but depends on the calculation method.
- Amorphous phases are not detected in the pole figure measurement.
- The Eulerian space has a very distorting metric. The ODF
representation in Eulerian space therefore easily leads to
misinterpretations when considering the usual 3D Cartesian
representation. The distortion for pole figures in the usual
stereographic projection must also be considered.
+ From EBSD data, however, the ODF can be constructed unambiguously by
writing the measured volume-weighted or number-weighted orientation of
the crystallites, for example in 3D Eulerian space.
+ This ODF can then be compared to the results of current measurements
(conventional pole figure measurement by X-ray diffraction, synchrotron
or neutron) or to historical measurements from the literature.
+ The ODF in serial development according to Bunge is a very compact
summary. When the textures are not too flat, a few development
coefficients are often sufficient for useful texture characterization
and material property estimation.
_____________
[1] H.-J. Bunge: Texture analysis in materials science - Mathematical methods. Butterworths, London 1982 (ISBN 0-408-10642-5)
Download  Paper back reprint: Cuvillier-Verlag Göttingen 1993 ( ISBN 3-928815-81-4)
[2] F. Wagner: Texture determination by individual orientation
measurements. In: Experimental Techniques of Texture Analysis, H.J.
Bunge (ed.). DGM-Informations-Ges., Oberursel 1986, 115-123 (ISBN
3-88355-101-5)
[3] J. Pospiech: The smoothing of the orientation distribution density
introduced by calculation methods. Textures and Microstructures 26-27 (1996) 83-91