|
|
Crystallographic Texture |
The X-ray scanning apparatus (XSA)
|
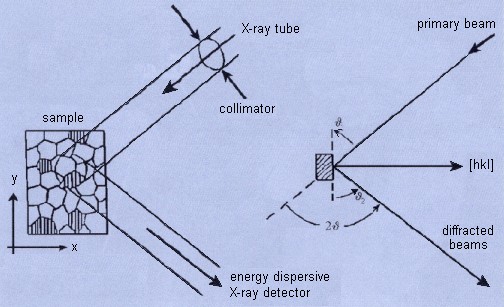
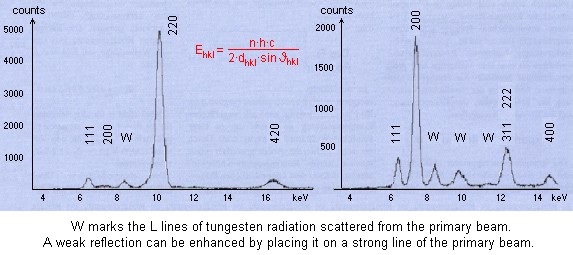
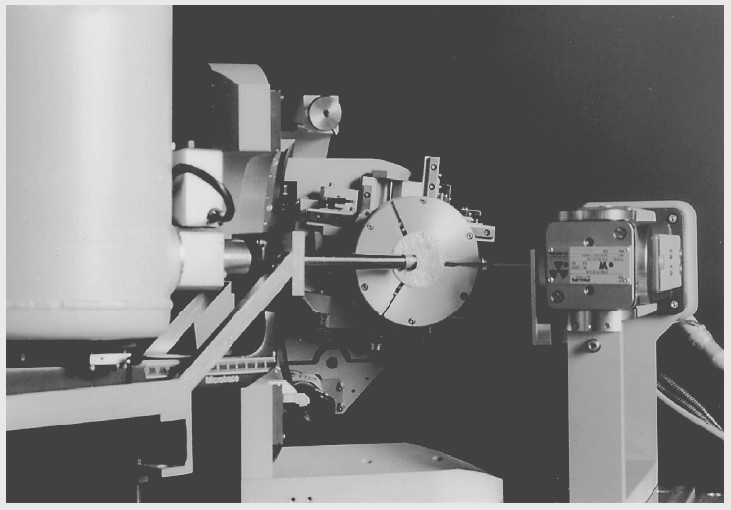
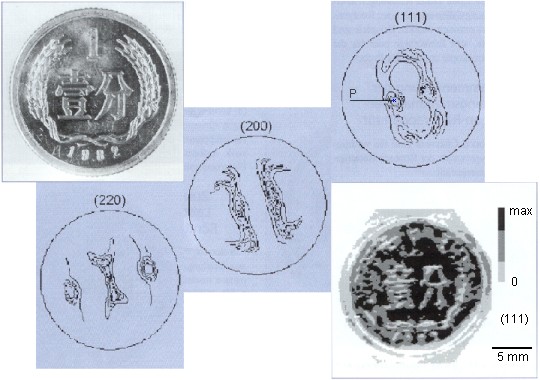
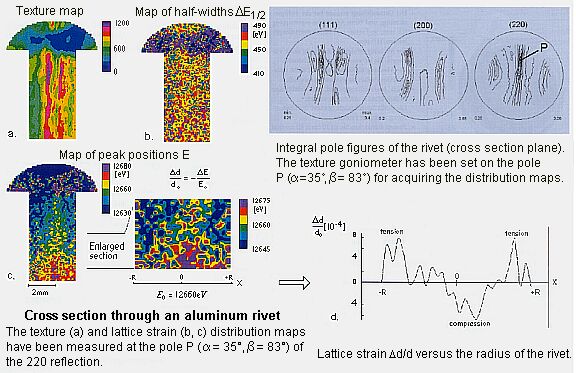
An x-ray scanning apparatus for imaging the spatial distributions of crystal texture, residual lattice strain and elements in bulk samples has been extended to pole figure measurement on selected small areas. Some limitations specific for analytical electron microscopy are thus avoided. The system is based on a two-circle goniometer and an open Euler cradle (PHILIPS X'Pert MRD goniometer) with a stepping-motor driven x-y sample stage which allows the sample to be translated in 1 μm wide steps over an area of 100 mm by 100 mm. An annular collimator is used to stop down the white primary beam to a narrow spot on the specimen surface. A wide spectrum of secondary x-rays is emitted from the illuminated spots which is composed of broad diffraction peaks, sharp characteristic fluorescence lines, and a low background of scattered radiation. The diffracted secondary spectrum is detected either with a conventional proportional counter and post-specimen filter for pole figure measurements, or with a standard energy dispersive (ED) solid state spectrometer system for acquiring texture, lattice strain, and element maps. The spatial distributions of selected crystallographic directions or elements in the sample surface are acquired by translating the sample step by step in a user defined grid. Several texture distribution as well as the element composition maps can be obtained simultaneously. Residual lattice strain is analyzed in addition by evaluating the shape and location of diffraction peaks in the spectrum at each image point. Local resolution is presently limited to 50 μm, as a consequence of the low intensity of a collimated primary beam. Pole-figure measurement is performed on the same sample area prior to crystal texture mapping to find out significant texture components. The specimen remains fixed on the stage and need not be realigned when passing from measurement of pole figures to mapping of texture and elements. The apparatus is fully PC-controlled. Equal step, equal area, thinned or incomplete angular grids can be generated on the pole sphere. The development
The X-ray scanning apparatus (XSA) and ED diffraction The principles of texture topography and
lattice strain mapping The setup of the X-ray scanning apparatus (XSA) View of the X-ray scanning apparatus Application 1 of the X-ray scanning apparatus (XSA)
Application 2 of the X-ray scanning apparatus (XSA)
Application 3 Imaging Micro-XFA A test specimen for imaging micro X-ray fluorescence analysis and for checking spatial resolution has been made by sputter-depositing gold through a TEM support grid on a glass substrate. Regular gold patches 420 μm by 420 μm wide are formed, separated by free bars of < 60 μm.
Gold pattern made by sputtering through a TEM support grid. |

